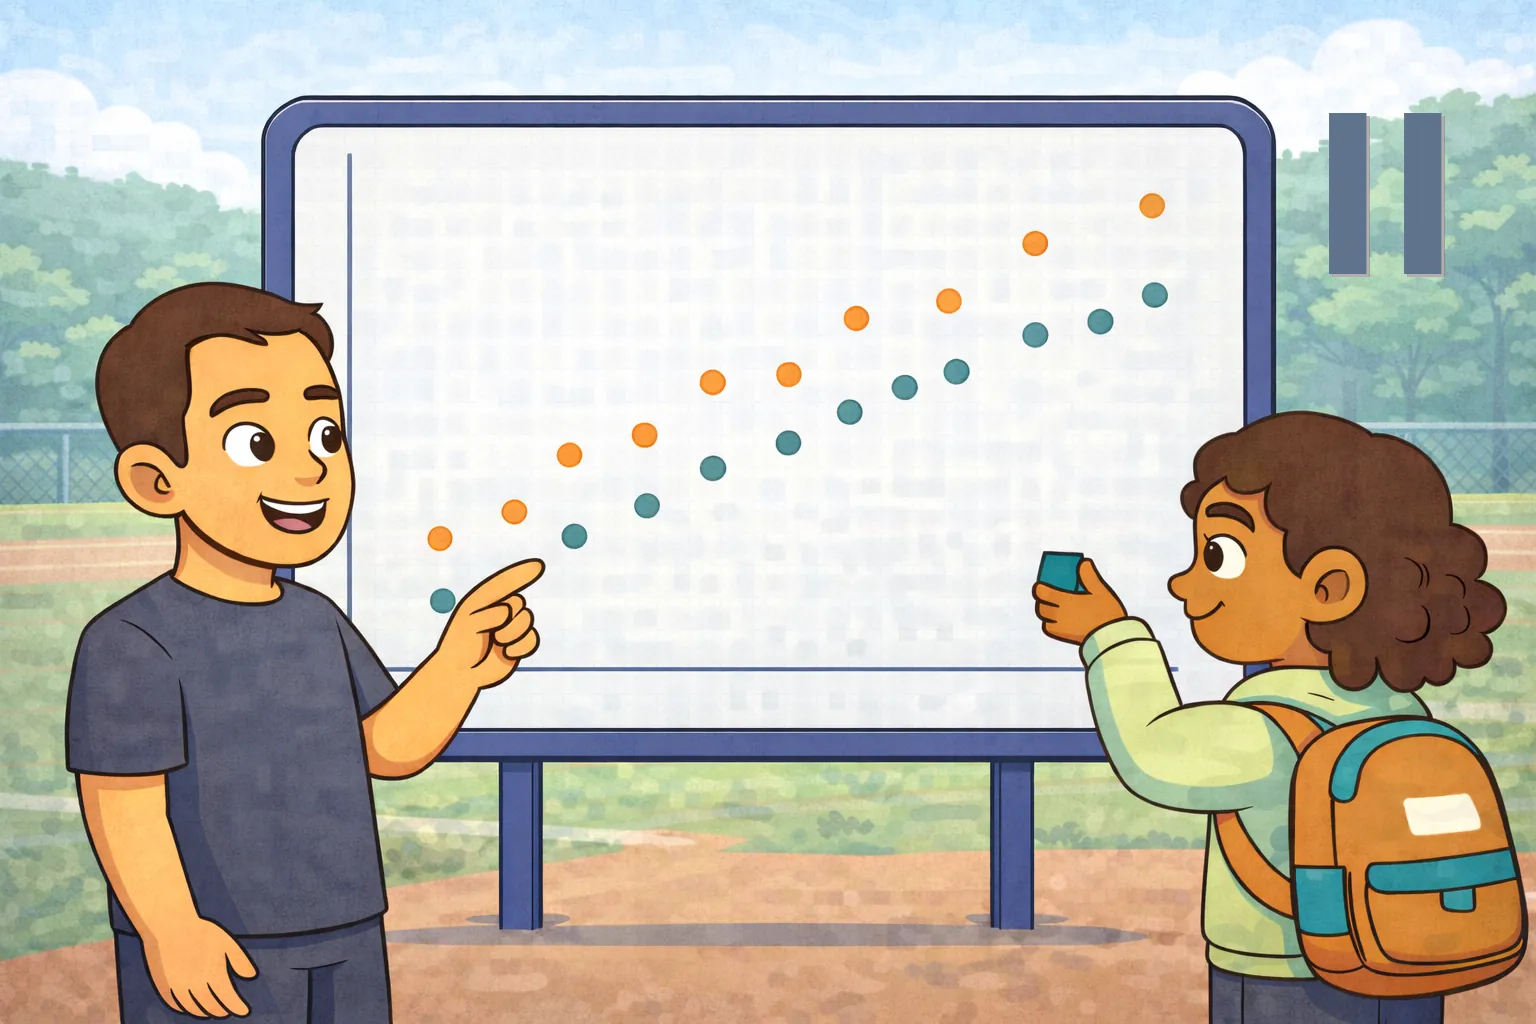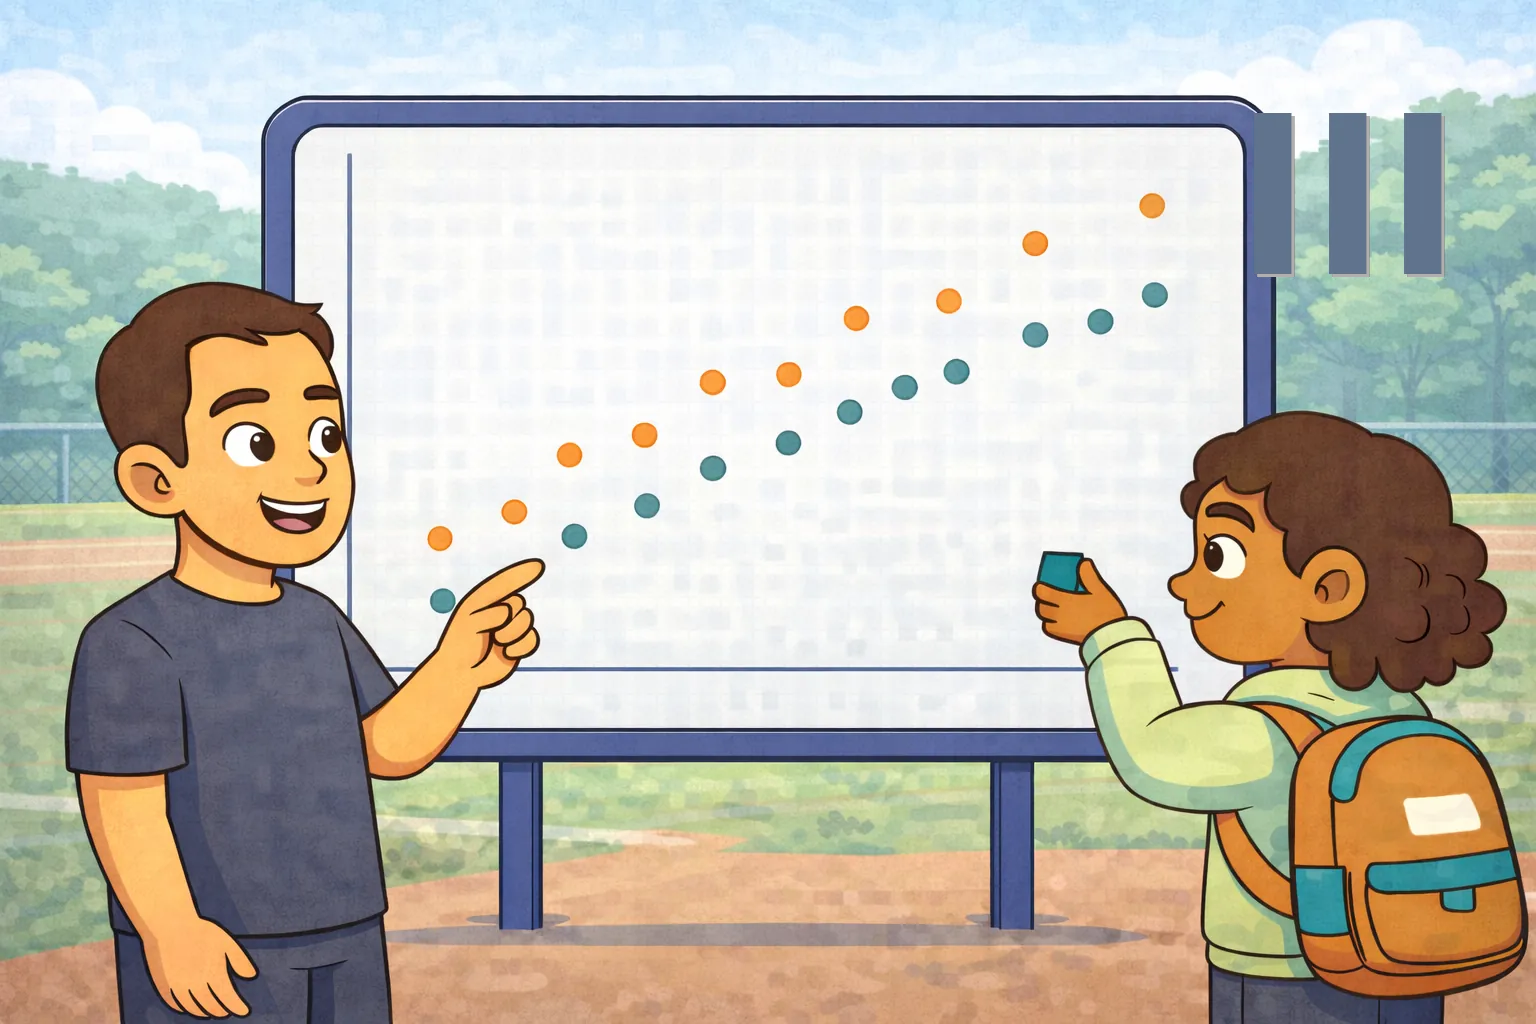

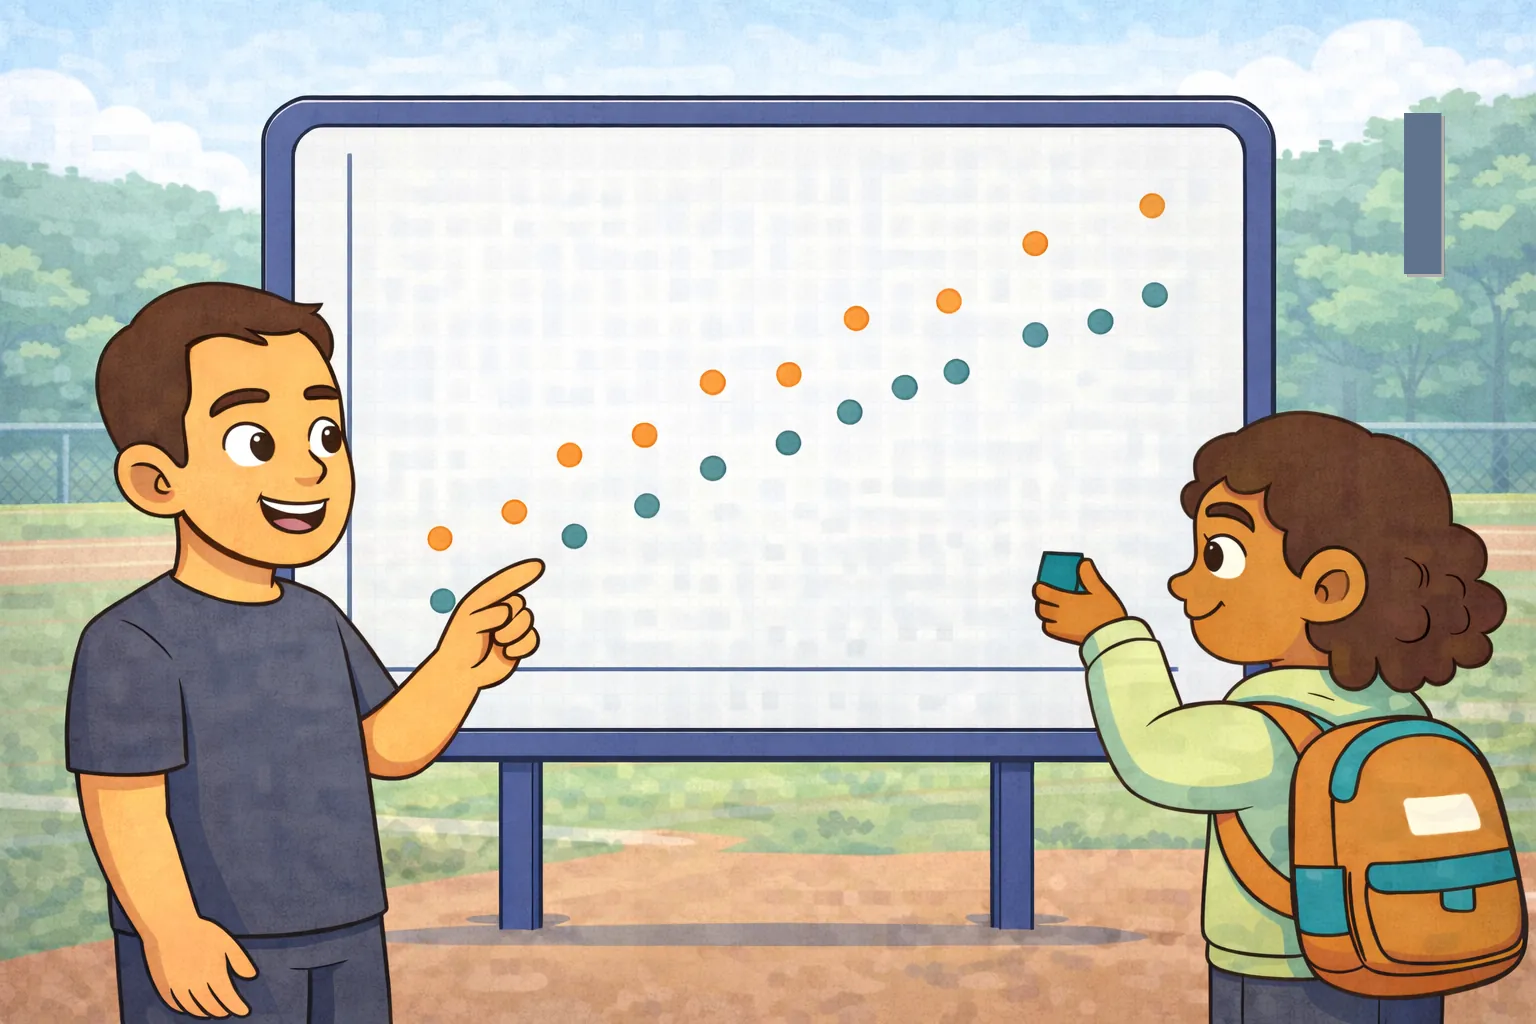
Before a regional track meet, Emek and Luna helped the coach choose the relay team. They recorded each athlete's 100-meter sprint time and reaction time, then plotted every pair of values on a scatterplot. Most points showed a negative relationship: athletes with shorter reaction times also tended to have faster sprint times. A few points did not fit the pattern exactly, so they discussed those runners carefully instead of relying on a single result. Using the overall trend, they recommended a balanced relay team, and the coach confidently announced the final lineup.
Challenges
Challenge 1 of 5
Challenges
Challenge 1 of 4
Hint
Each plotted pair contains two measurements for the same athlete.
What does one point on Emek and Luna's scatterplot represent?
The number of athletes at the track meetThe total sprint time of the whole teamOne athlete's reaction time and sprint timeOne athlete's position in the relayCorrect! Each point represents both recorded times for one athlete.
Remember that a point on a scatterplot represents a pair of values for one individual.
Next🎉 Congrats! You got this question!
Hint
Subtract the number of points that did not fit from the total number of athletes.
The coach studied 12 athletes. If 3 athletes had points that did not fit the overall scatterplot pattern, how many athletes had points that did fit the pattern?
Correct! Nine athletes had points that fit the overall pattern.
Subtract the 3 unusual points from the 12 total points.
Next🎉 Congrats! You got this question!
Hint
A trend is useful, but unusual points may contain important information.
Which conclusion is most appropriate when Emek and Luna use the scatterplot to recommend relay runners?
Ignore every point that is different from the others.Choose a runner using only one reaction-time result.Use the overall pattern, but also examine athletes whose points do not fit it.Assume the scatterplot proves that reaction time causes sprint performance.Correct! The overall trend and the unusual points should both be considered.
A scatterplot shows an overall relationship, but it should not be used without examining unusual data.
Next🎉🎉🎉🎉🎉🎉🎉🎉
🎉 Congrats! You finished this challenge set!