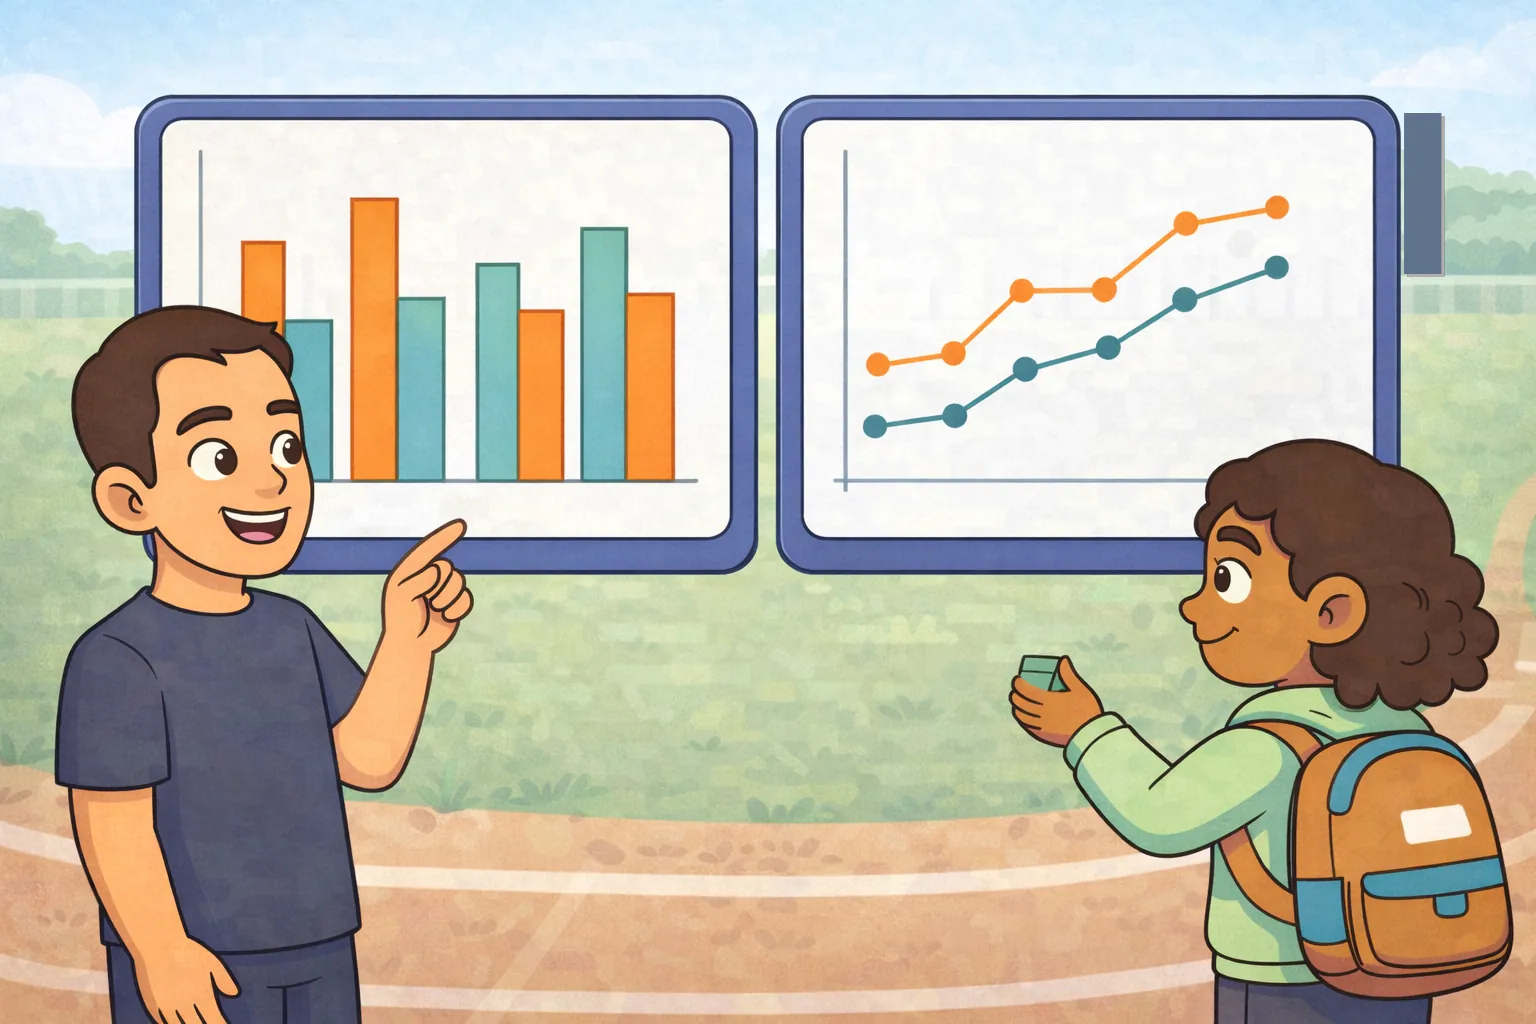
Before an important basketball game, Emek and Luna studied graphs showing how many shots players made out of 20 during two training drills. For Drill A, the results from six sessions were 12, 15, 13, 17, 11, and 16, with a mean of 14 and a range of 6. Drill B produced 14, 15, 16, 15, 14, and 16, with a mean of 15 and a range of 2. Emek noticed that Drill A sometimes produced high scores, but its results were spread widely. Luna pointed out that Drill B had both a higher center and a smaller spread, with every result between 14 and 16. The graph also showed its scores clustered closely around 15. Since the team wanted reliable shooting before the game, Emek and Luna recommended repeating Drill B. The players followed their plan, confident that the decision was supported by the overall pattern of the data.