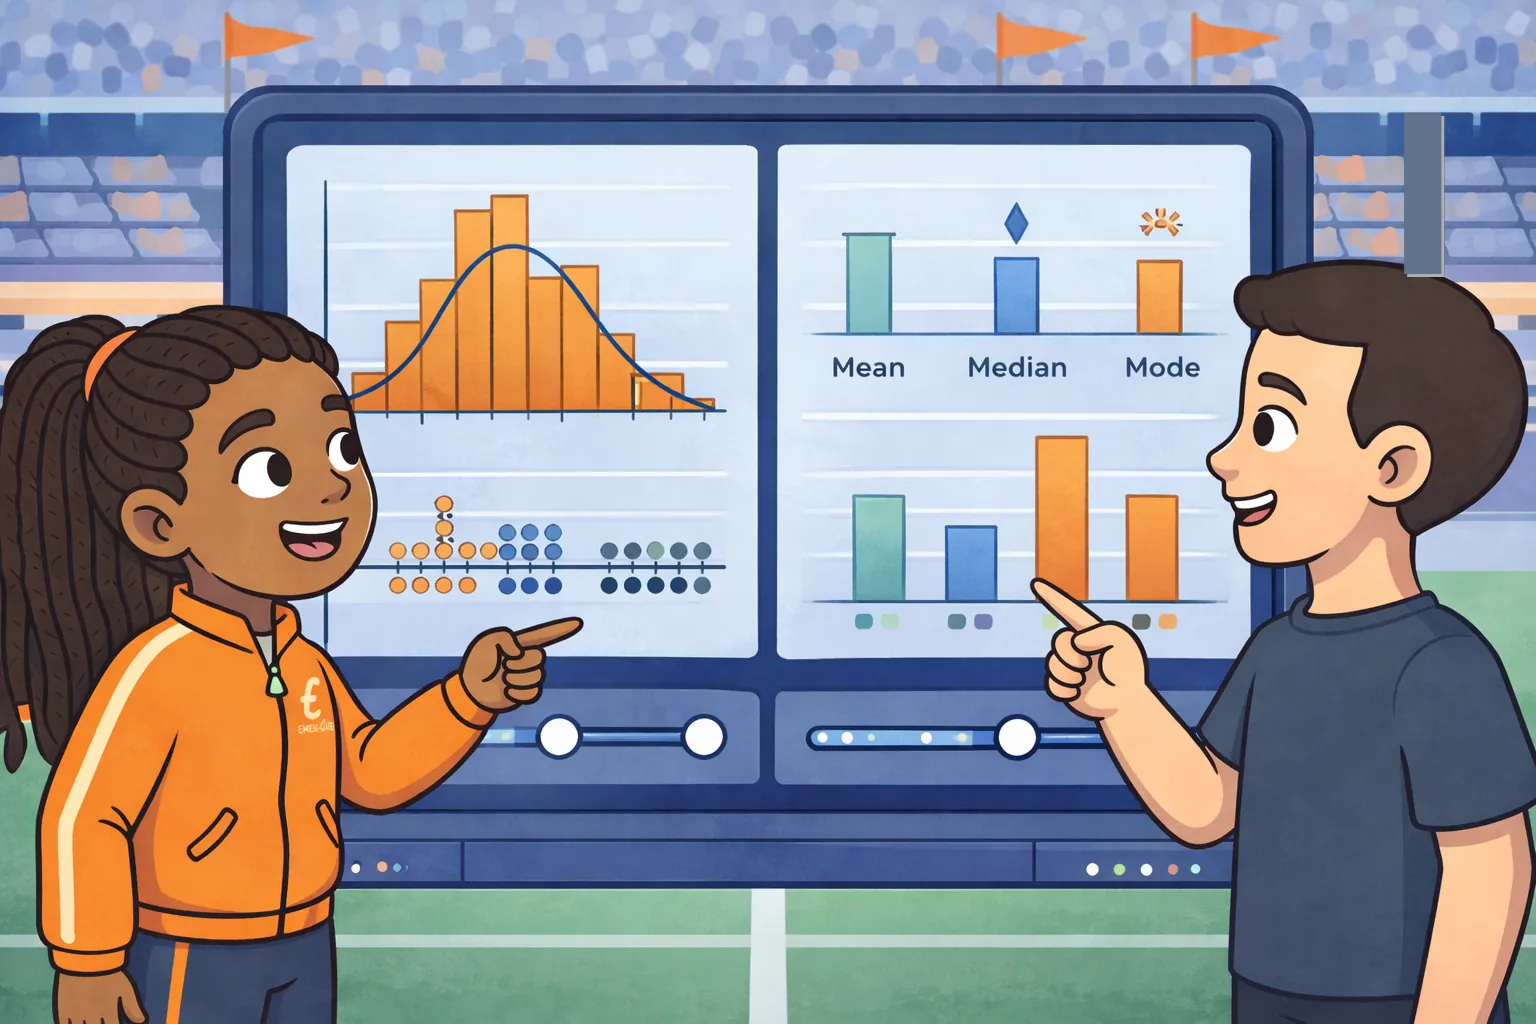

A professional training center asked Tara and Emek to analyze several months of player performance data before the next season. They compared score distributions, training results, and recovery times across different groups of athletes. Rather than focusing on a few outstanding performances, they interpreted summary measures such as the mean, median, interquartile range, and variability to identify consistent strengths and weaknesses. They also looked for patterns and possible outliers that could affect coaching decisions. Their report helped the coaches design targeted practice plans that improved the team's overall performance.
Challenges
Challenge 1 of 5
Challenges
Challenge 1 of 4
Hint
A smaller interquartile range means the middle half of the data is more tightly grouped.
Two athlete groups have the same median score of 82. Group A has an interquartile range of 6, while Group B has an interquartile range of 14. Which conclusion best supports the coaches' goal of finding consistent performance?
Group B is more consistent because its interquartile range is larger.Group A is more consistent because its middle 50% of scores are less spread out.Both groups are equally consistent because their medians are equal.Consistency cannot be compared using the interquartile range.Correct! Group A's smaller interquartile range indicates more consistent scores.
Compare how widely the middle 50% of scores are spread in each group.
Next🎉 Congrats! You got this question!
Hint
Find Q1 and Q3, then subtract Q1 from Q3.
Tara and Emek recorded the ordered recovery times 8, 9, 10, 11, 12, 13, 14, and 15 hours. Using the median of the lower half as Q1 and the median of the upper half as Q3, what is the interquartile range?
Correct! The interquartile range is 4 hours.
Find the median of each half of the ordered data before subtracting.
Next🎉 Congrats! You got this question!
Hint
Consider which measure uses every value and which depends mainly on the middle position.
One athlete's training scores are 78, 80, 81, 82, and 99. Which statement best explains how the score of 99 affects the summary measures?
It raises the mean more than the median because it is much larger than the other scores.It lowers both the mean and the median.It changes the median to 99.It has no effect on either the mean or the median.Correct! The unusually high score pulls the mean upward while the median remains 81.
Think about how an extreme value affects the average compared with the middle value.
Next🎉🎉🎉🎉🎉🎉🎉🎉
🎉 Congrats! You finished this challenge set!