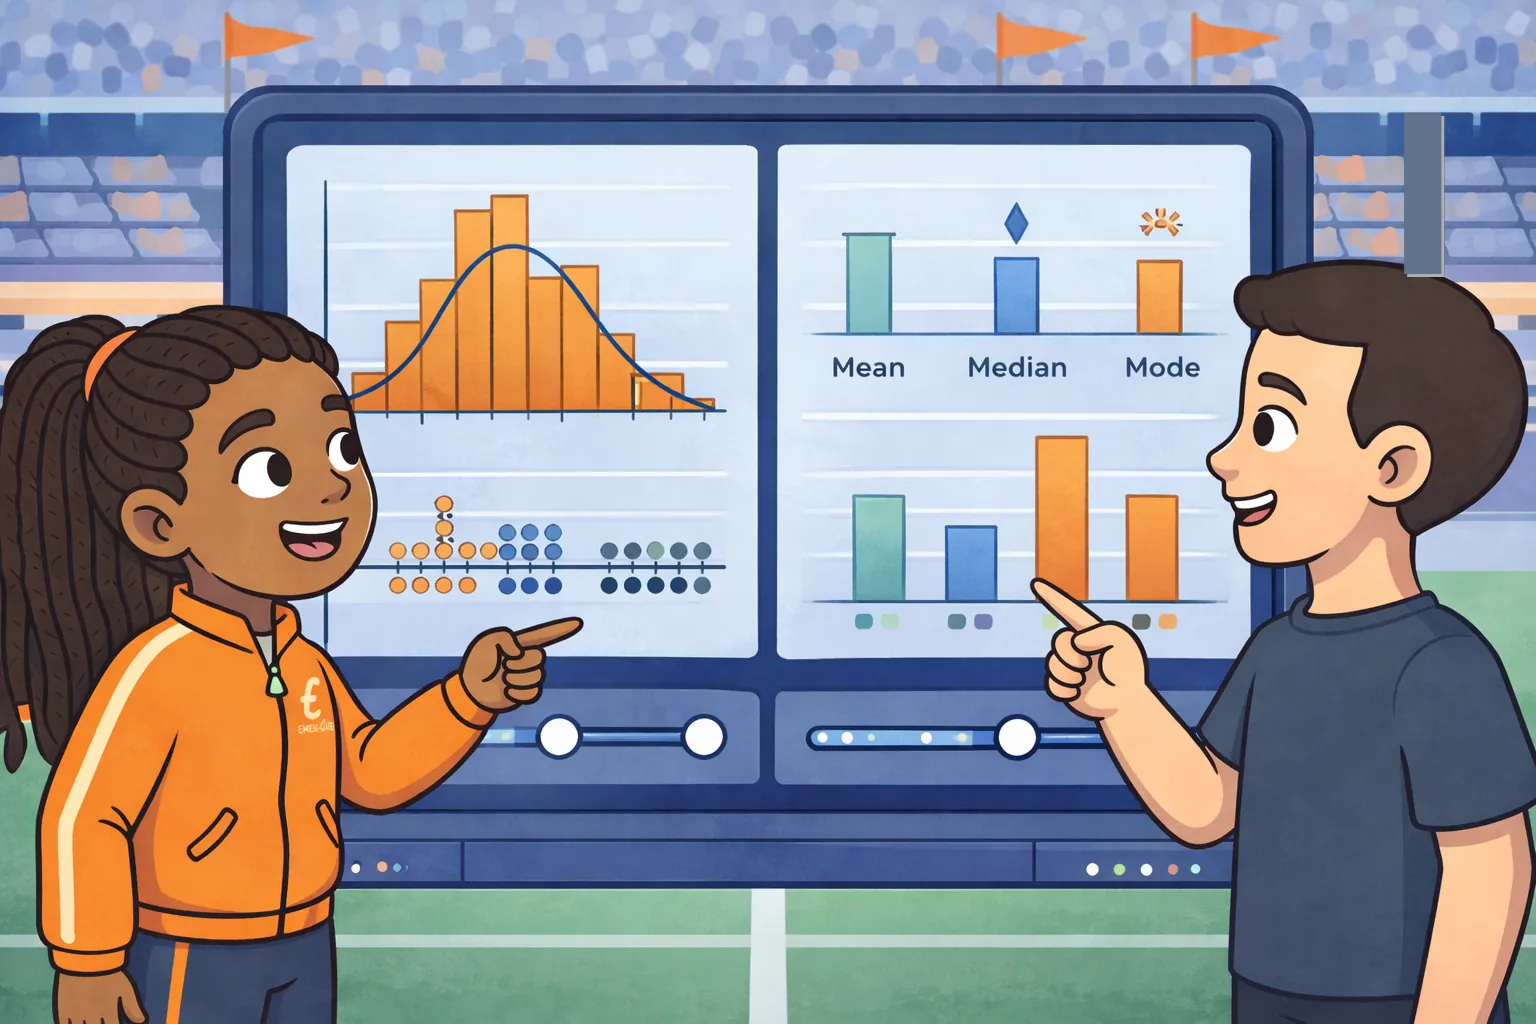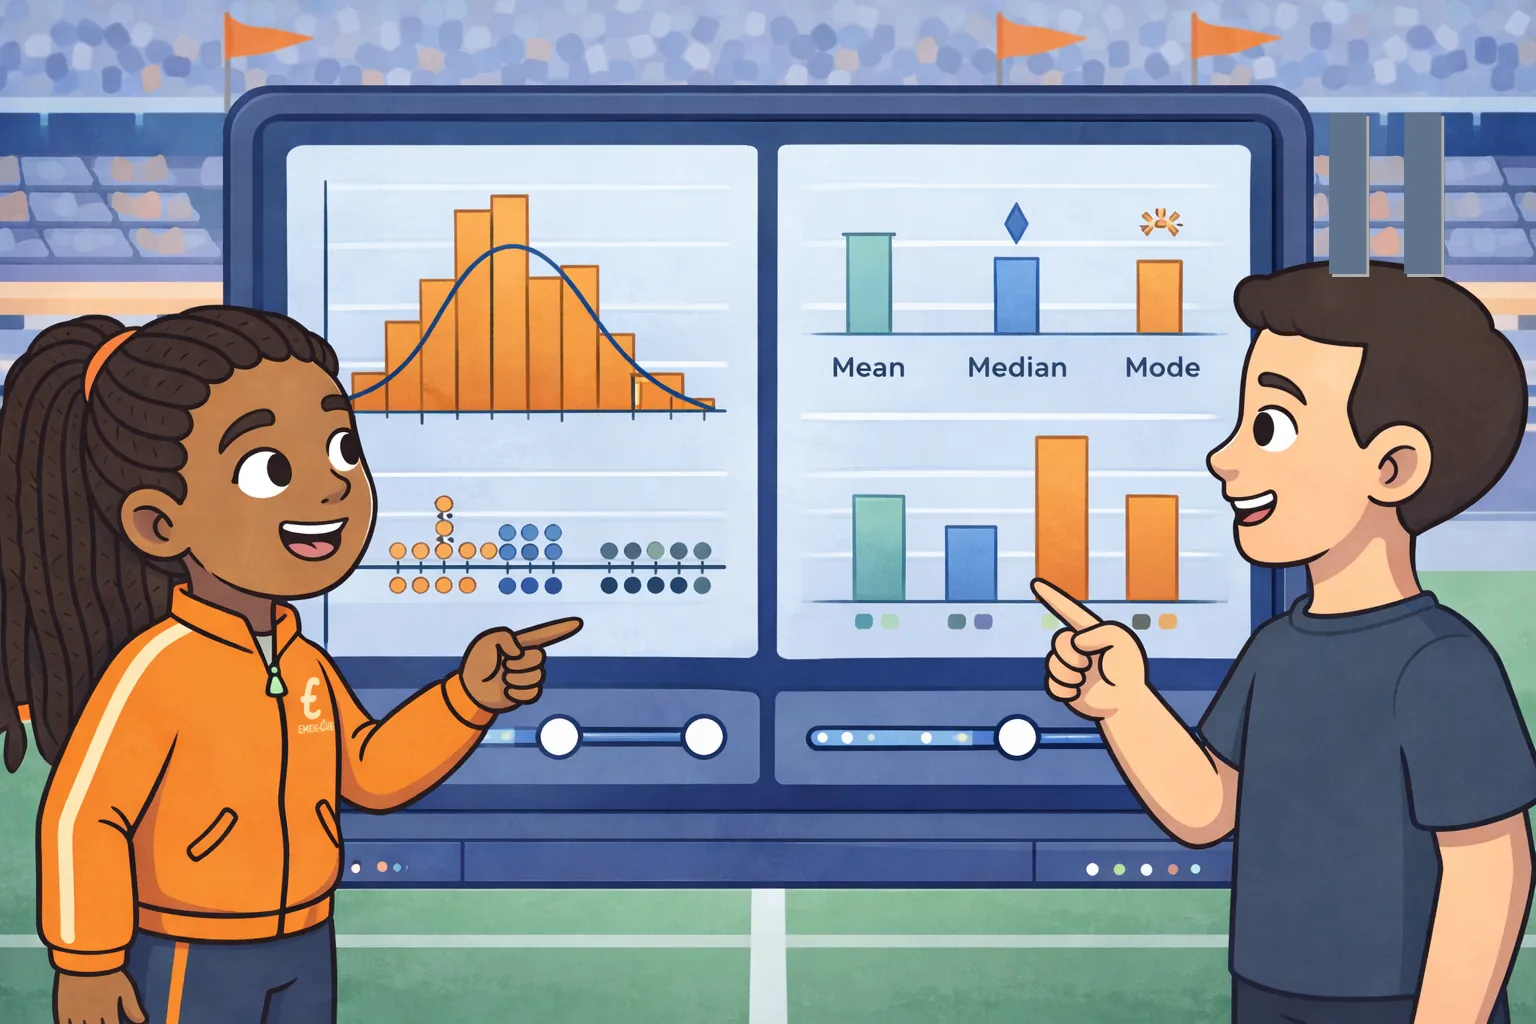

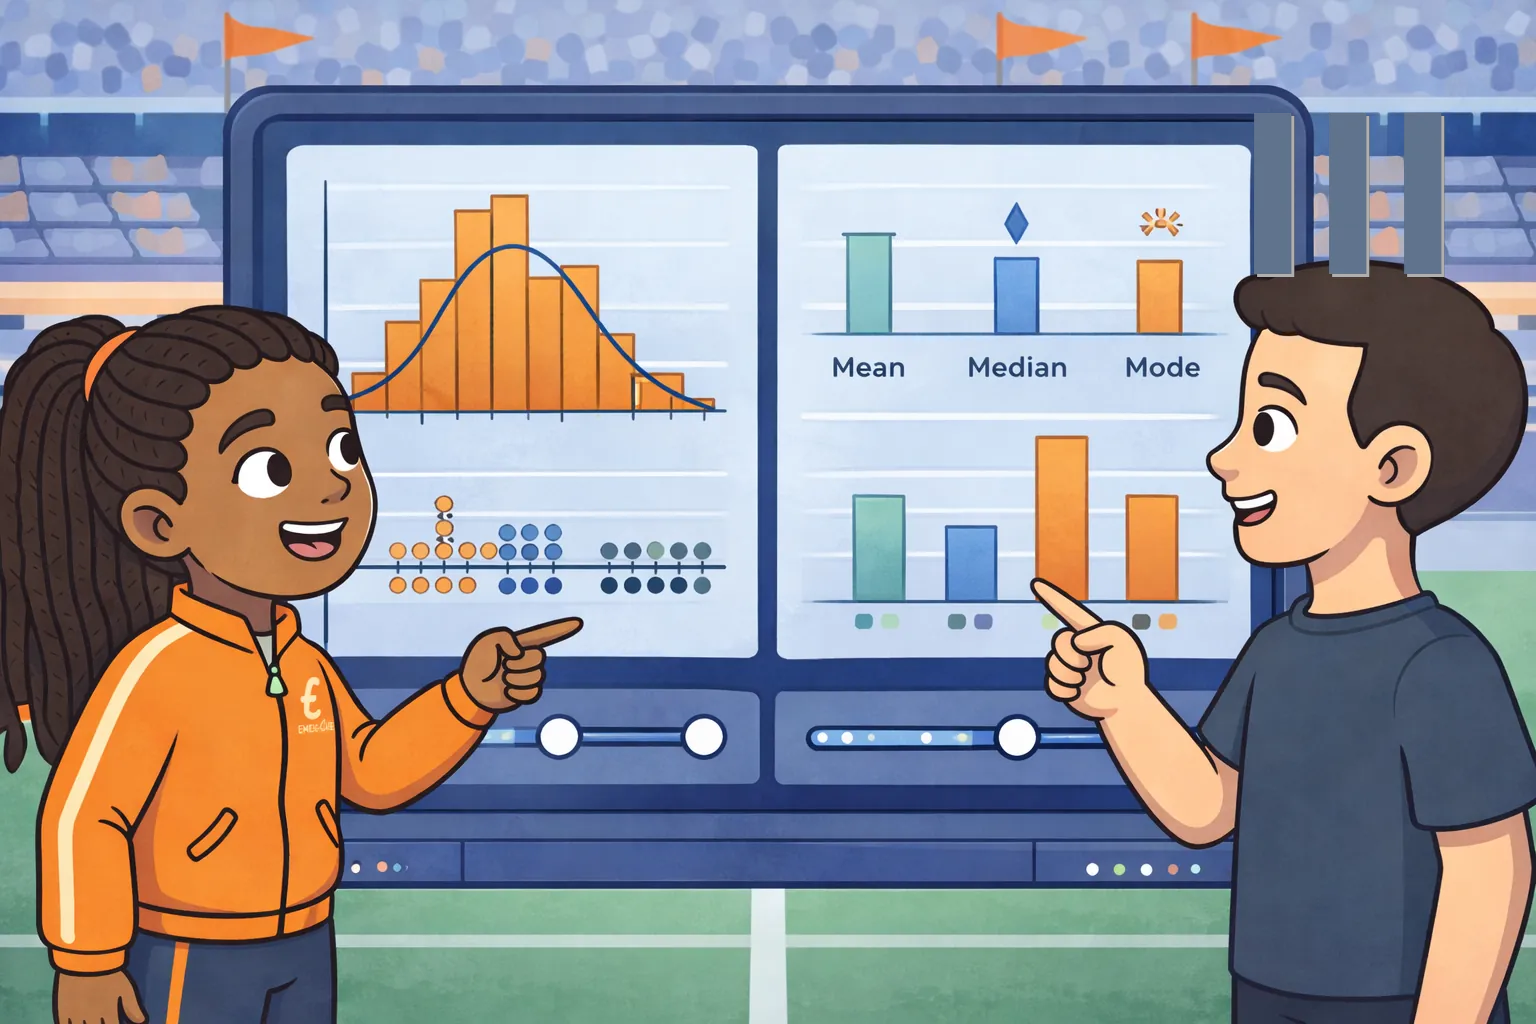
After an unexpected championship result, Tara and Emek were asked to determine whether the team's remarkable performances reflected genuine improvement or unusual statistical variation. They analyzed performance distributions from the entire season, compared summary statistics before and after the championship, and identified possible outliers that could distort the results. Rather than relying on a single exceptional performance, they evaluated the overall pattern of the data and verified their conclusions with careful statistical reasoning. Their evidence-based report helped the coaching staff make informed decisions for future training and competition.
Challenges
Challenge 1 of 5
Challenges
Challenge 1 of 4
Hint
Consider which measure is more sensitive to an extreme value.
Before the championship, the team's performance scores had a mean of 76 and a median of 77. After adding one championship score of 98, the mean increased noticeably while the median changed very little. Which conclusion is most reasonable?
The score of 98 may be an unusually high value that affects the mean more than the median.The score of 98 proves that every athlete improved equally.The median must always increase by the same amount as the mean.The score of 98 has no effect on any summary statistic.Correct! An unusually high score can pull the mean upward while having little effect on the median.
Think about how an extreme score affects the mean compared with the median.
Next🎉 Congrats! You got this question!
Hint
Find Q1 and Q3 from the two halves, then calculate Q3 - Q1.
Tara and Emek ordered the season scores as 68, 70, 72, 74, 76, 78, 80, and 98. Using the median of the lower half as Q1 and the median of the upper half as Q3, what is the interquartile range?
Correct! The interquartile range is 8.
Separate the ordered scores into equal halves before finding Q1 and Q3.
Next🎉 Congrats! You got this question!
Hint
Interpret the change in the center and the change in the spread together.
The team's median score increased from 74 before the championship to 75 after it, while the interquartile range decreased from 12 to 6. Which interpretation best supports genuine overall improvement?
Only one athlete improved because the median changed by just 1.The typical score improved slightly, and the middle 50% of performances became more consistent.The team's scores became more variable because the interquartile range decreased.No conclusion can be made because medians and interquartile ranges do not describe distributions.Correct! The higher median and smaller interquartile range suggest slightly better and more consistent performances.
Consider what a higher median and a smaller interquartile range each indicate.
Next🎉🎉🎉🎉🎉🎉🎉🎉
🎉 Congrats! You finished this challenge set!